Visualization
SCROLL DOWN!
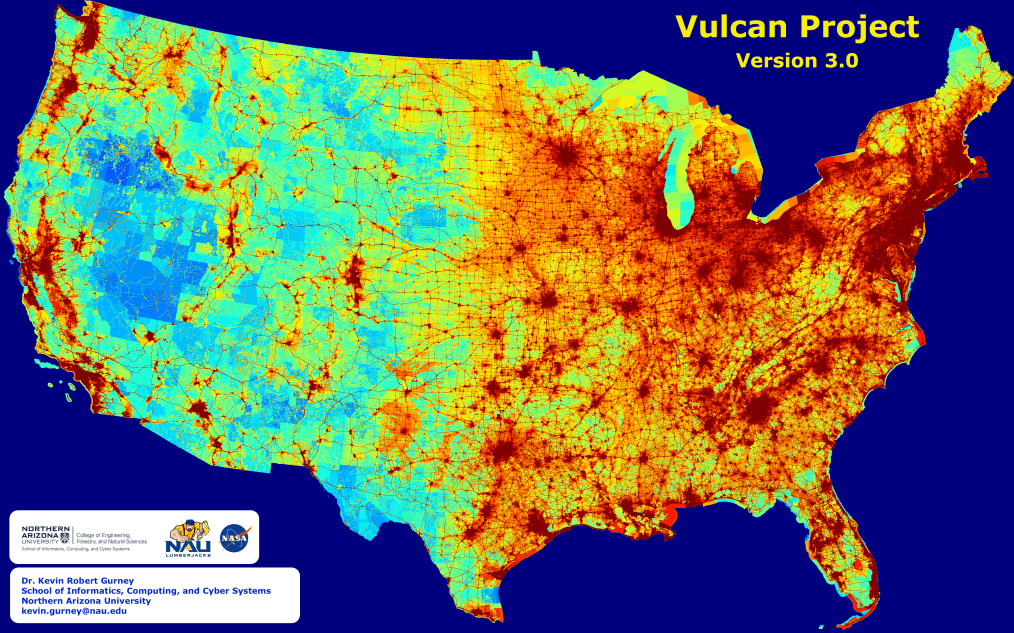
The following visualizations offers a graphic glimpse into the Vulcan FFCO2 emissions.

SCROLL DOWN!
The following visualizations offers a graphic glimpse into the Vulcan FFCO2 emissions.
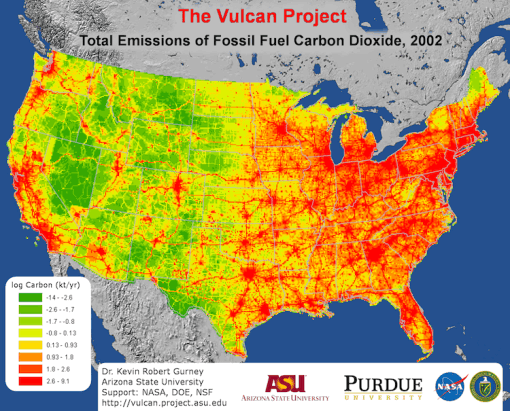
The complete Vulcan CO2 emissions (all sectors - those presented in the first four figures above) after it has been gridded to the common 10 km x 10 km Vulcan grid. The units are log base 10 of metric tonnes of carbon/gridcell/year.
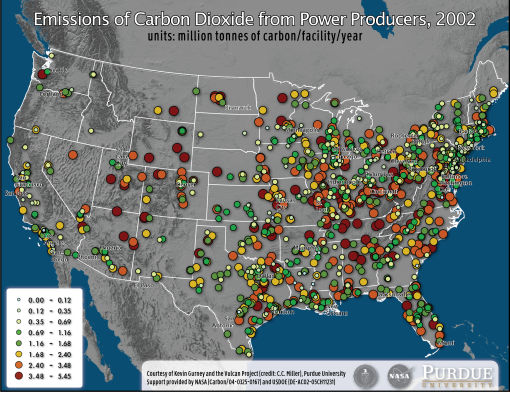
The location and matnitude of FFCO2 emissions from major electricity production facilities under the Continuous Emissions Monitoring (CEM) program of the Emissions Trading System. Units: Million tonnes of carbon/facility/year.
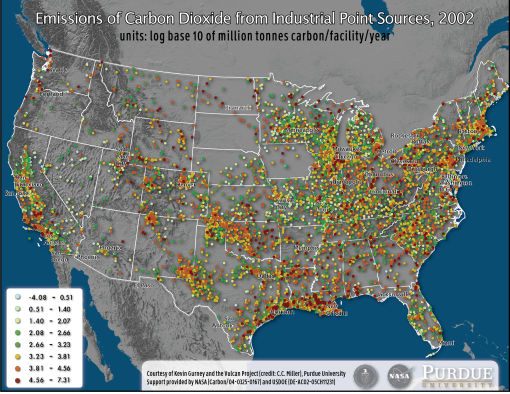
The location and magnitude of the industrial point sources of FFCO2 emissions derived from the National Emissions Inventory. Units: Log base 10 of million tonnes of carbon/facility/year
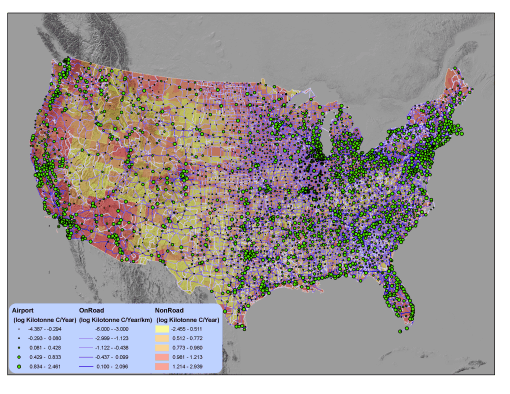
Mobirise gives you the freedom to develop as many websites as you like given the fact that it is a desktop app.
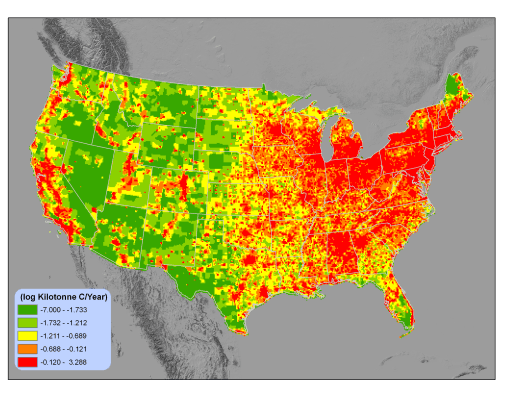
Mobirise is an easy website builder - just drop site elements to your page, add content and style it to look the way you like.
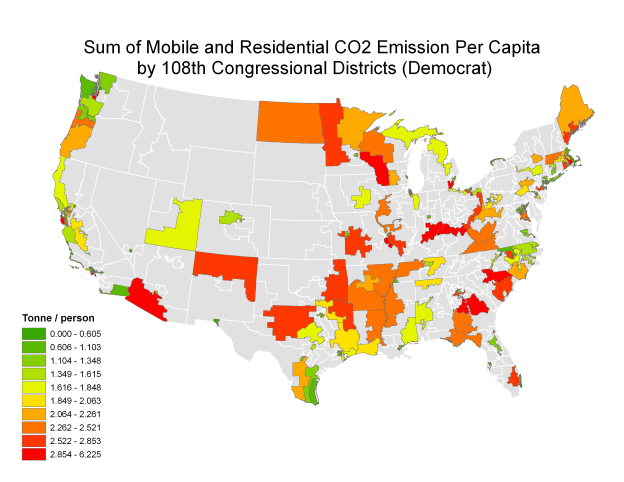
This shows the sum of the Vulcan onroad and residential FFCO2 emissions by Democrat held congressional districts for the 108th US Congress.
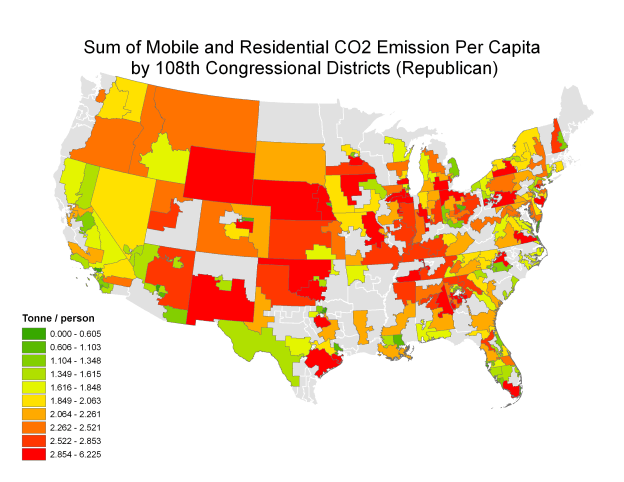
This shows the sum of the Vulcan onroad and residential FFCO2 emissions by Republican held congressional districts for the 108th US Congress.
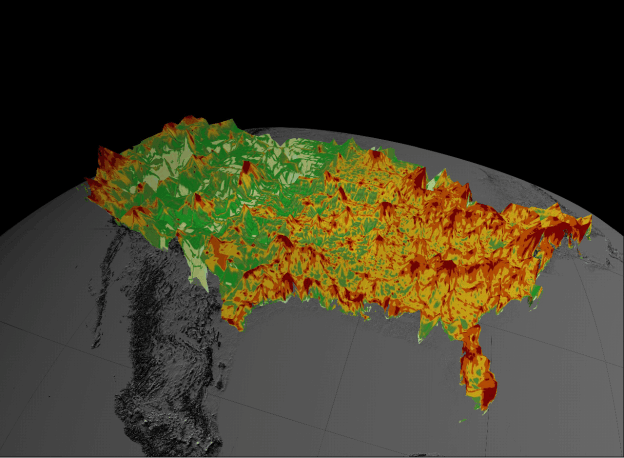
Total Vulcan FFCO2 emissions represented on a 3D grid.
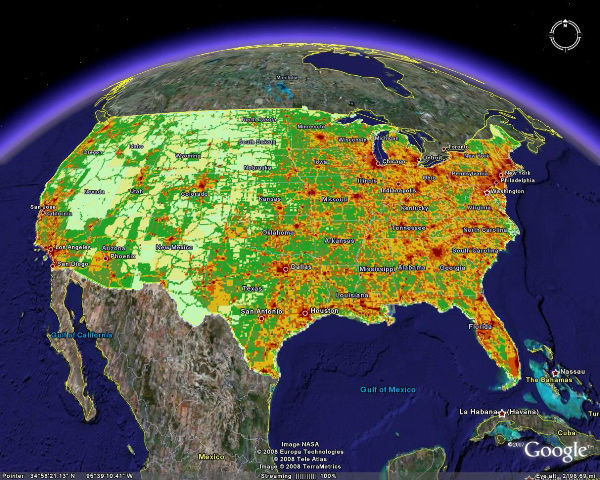
Total Vulcan FFCO2 emissions represented on Google Earth.
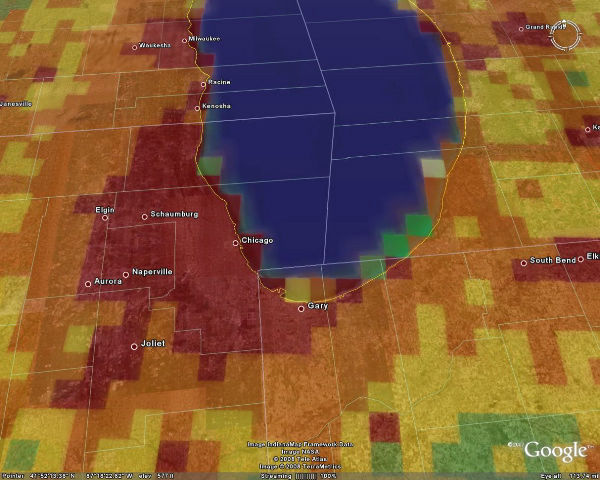
Total Vulcan FFCO2 emissions represented on Google Earth zoomed into the Chicago area.
Drag & Drop Website Builder